| Client: | Bay Area Rapid Transit (BART) |
| Dates: | May 2016 |
| Skills/Subjects: | interaction design, mobile, presentation, prototyping |
| URL: | http://andyhub.com/wordpress/wp-content/uploads/IoT-for-Cities-Hackathon.pdf |
Motivation
I worked with Learie Hercules, Sergio Prada, Veda Rogers, Patrick Shaughnessy at the IoT for Cities Hackathon at the 2016 Internet of Things World. Hercules had some experience working with BART and many group members, who lived in the Bay Area, lamented the friction in using BART during peak times. The most significant pain point they identified was what they called “random boarding” where people tend to board and de-board the train in a disorderly manner causing jams. They suggested that the best way to improve that experience would be to know which car had fewer people and preemptively queue for that particular car when waiting at the train platform.
Occupancy Sensing
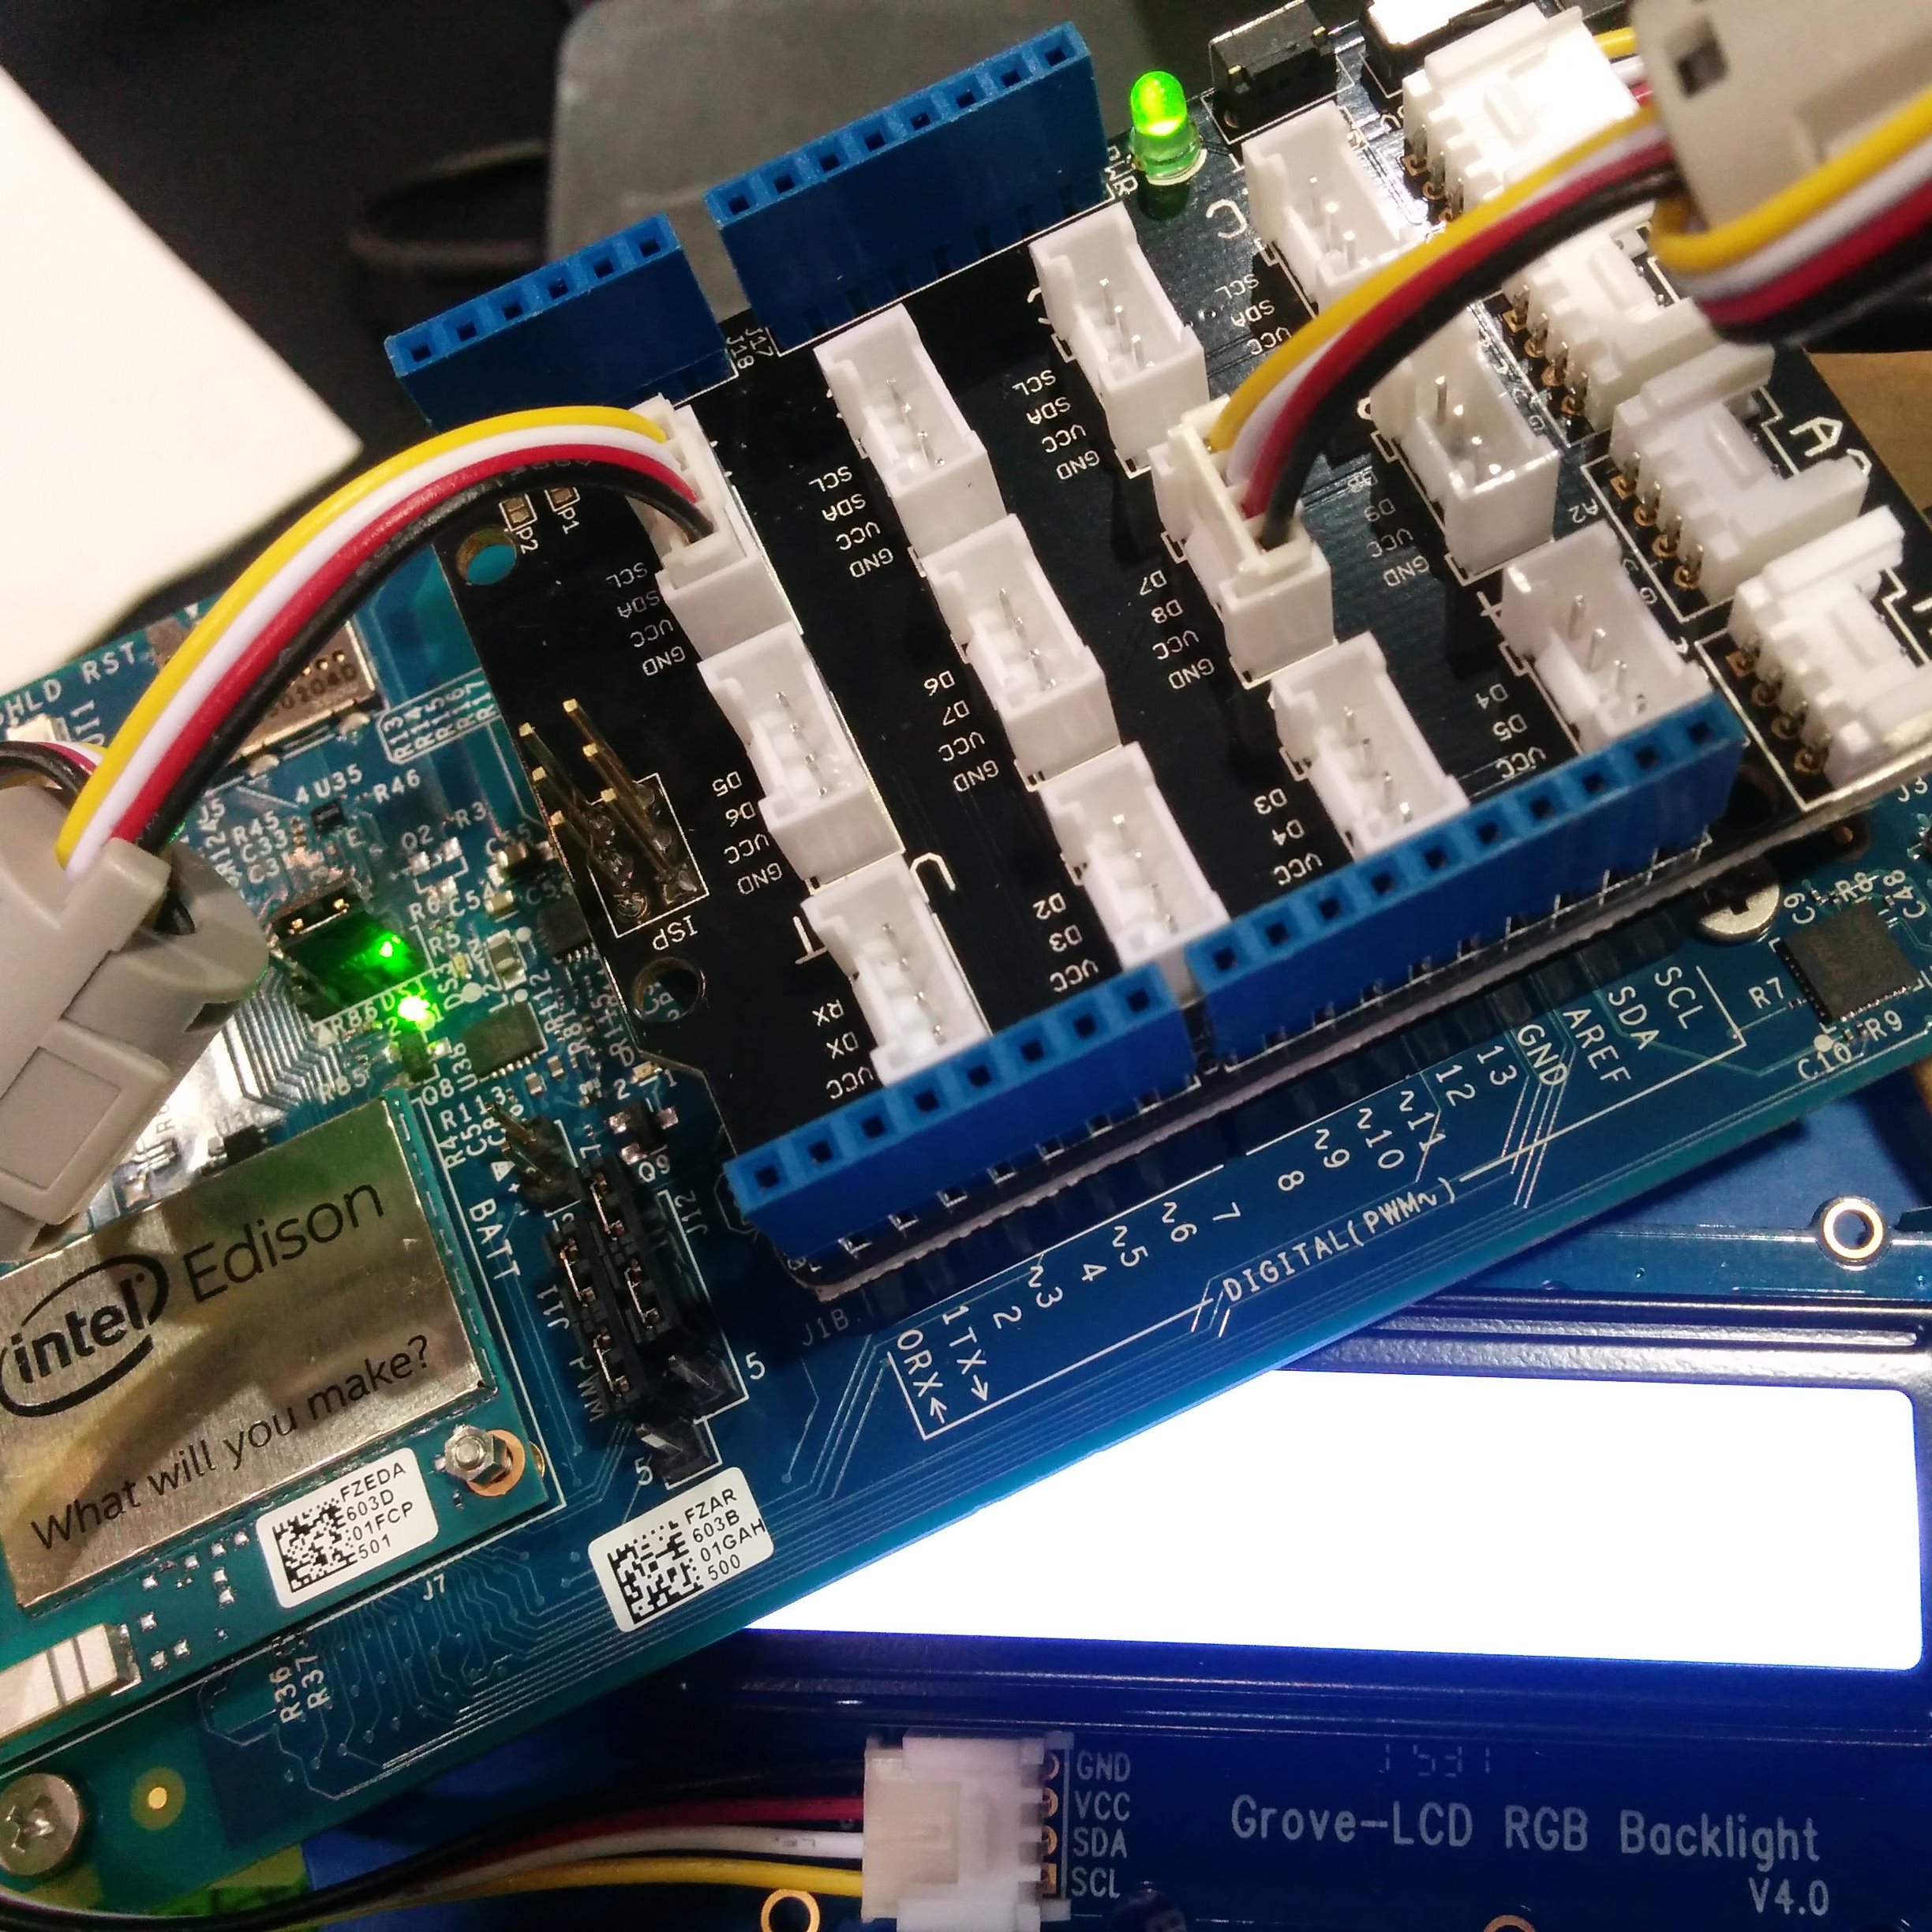
Our first goal was to figure out a way to gauge how full a train car may be. We looked into a few technical solutions as crowdsourcing alone wouldn’t provide the reliability necessary for this application. Since this event was sponsored by GE and Honeywell, we found that a good possibility would be to use a GE smart lamp in a train car to collect video and Honeywell people counting software on GE’s Predix platform. We didn’t have access to GE’s lamp, and they were reticent to give us any specs, so I prototyped one myself from an Intel Edison (pictured at the top of this page). This simply monitored the ambient noise level of the room and changed the LCD display to match the light-to-dark blue color scheme indicating low to high occupancy. These colors are described further later in this article.
This data could be used in three different ways: as a monitor for BART employees, a mobile web application that passengers already use, and indicators above platforms at train stations.
BART Monitor
We did not have direct access to a BART employee, so we needed to speculate some based on Hercules’ experience with BART administrators. Prada, Rogers, and Shaughnessy worked on a monitoring application for BART to keep an eye on the occupancy data in real time for potential optimization reasons. This can be found at Prada’s Github repo.
Mobile App
I mocked up a small UI change to the existing BART app that would provide this data for each car. By providing this information in addition to data like time to next train and overall load on the entire train (not per car), passengers could be informed of which car to preemptively queue for.
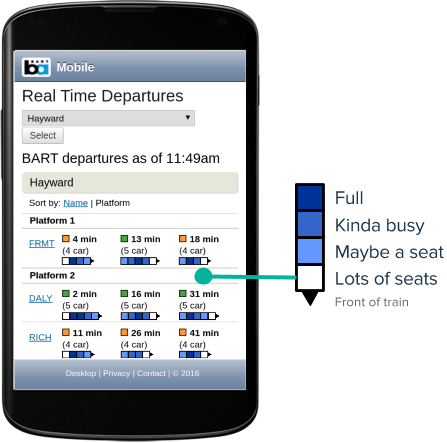
Mockup of change to mobile app showing per-car occupancy
Platform Indicators
Finally, I mocked up an in-place version of the mobile app idea. Since not everyone may use the mobile app, this same information could be presented as lamps above the train platforms. These lamps would use the same color scheme to indicate which cars have a higher or lower occupancy and prompt people to queue at cars with more seats available and perhaps avoid the more busy cars. Ideally, this information would improve boarding times.
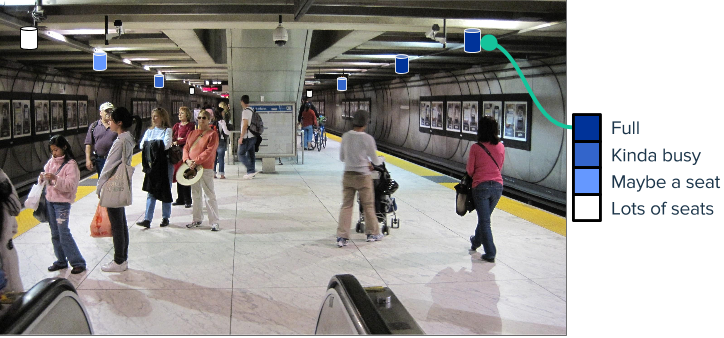
Lamps above the platform where train cars would arrive indicate their occupancy