| Client: | Truss, San Francisco |
| Dates: | March – April 2020 |
| Skills/Subjects: | civic media, interaction design, research, UI design, usability |
| URL: | https://sf.gov/apply-building-permit |
When COVID-19 closures started in early 2020, San Francisco was unable to accommodate emergency construction for housing. In just four weeks, we put their building permitting process online!
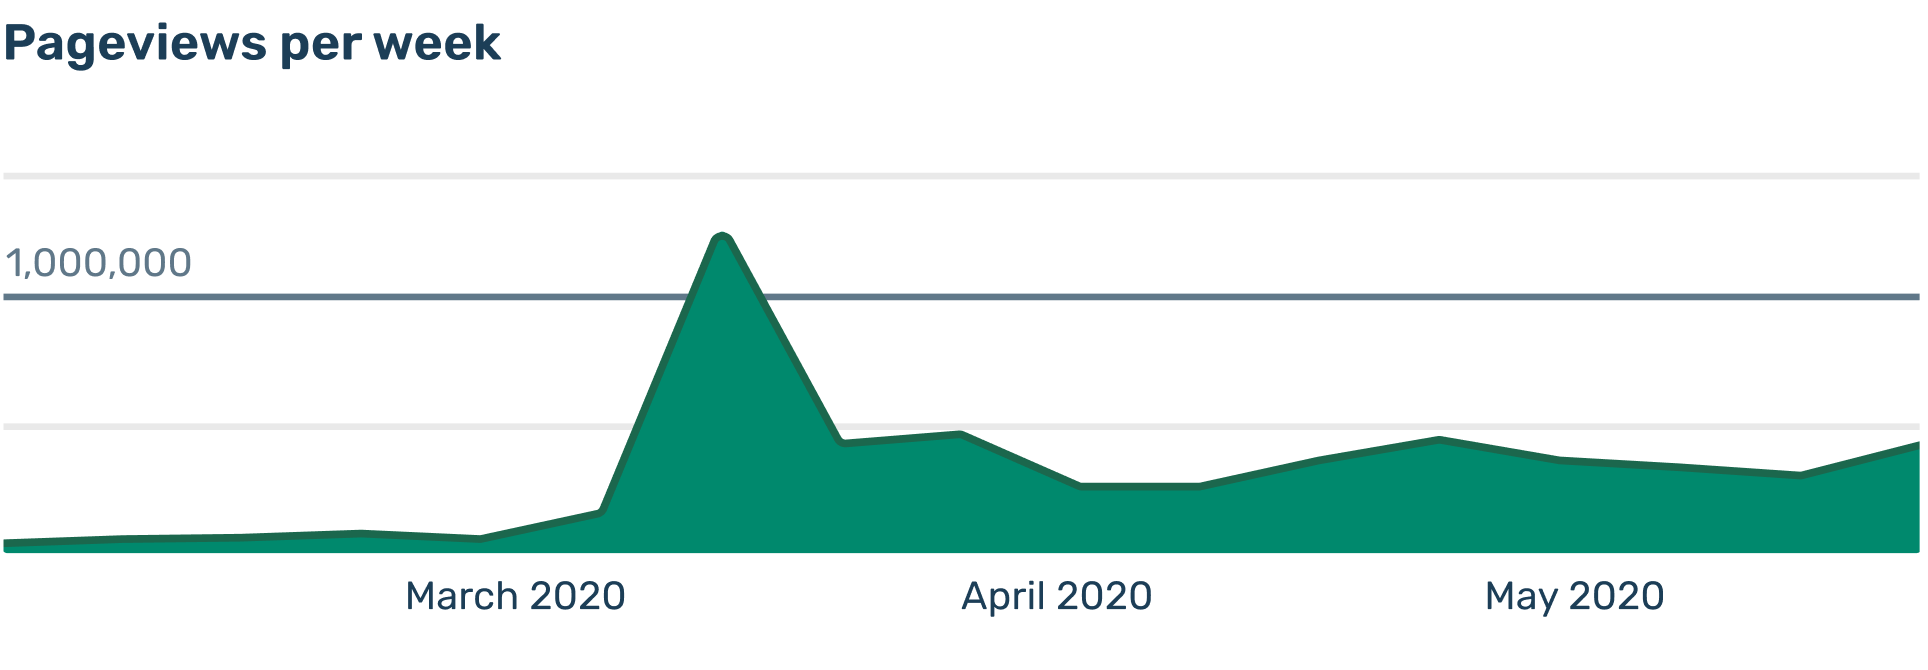
San Francisco’s permitting office was in the midst of transforming processing applications from a paper-based workflow to a digital-based workflow. A critical piece of this effort was the ability for someone to apply for a permit online via sf.gov’s website. In March 2020, there was a massive scramble for information in San Francisco, including how to continue doing normal things like filing permits.

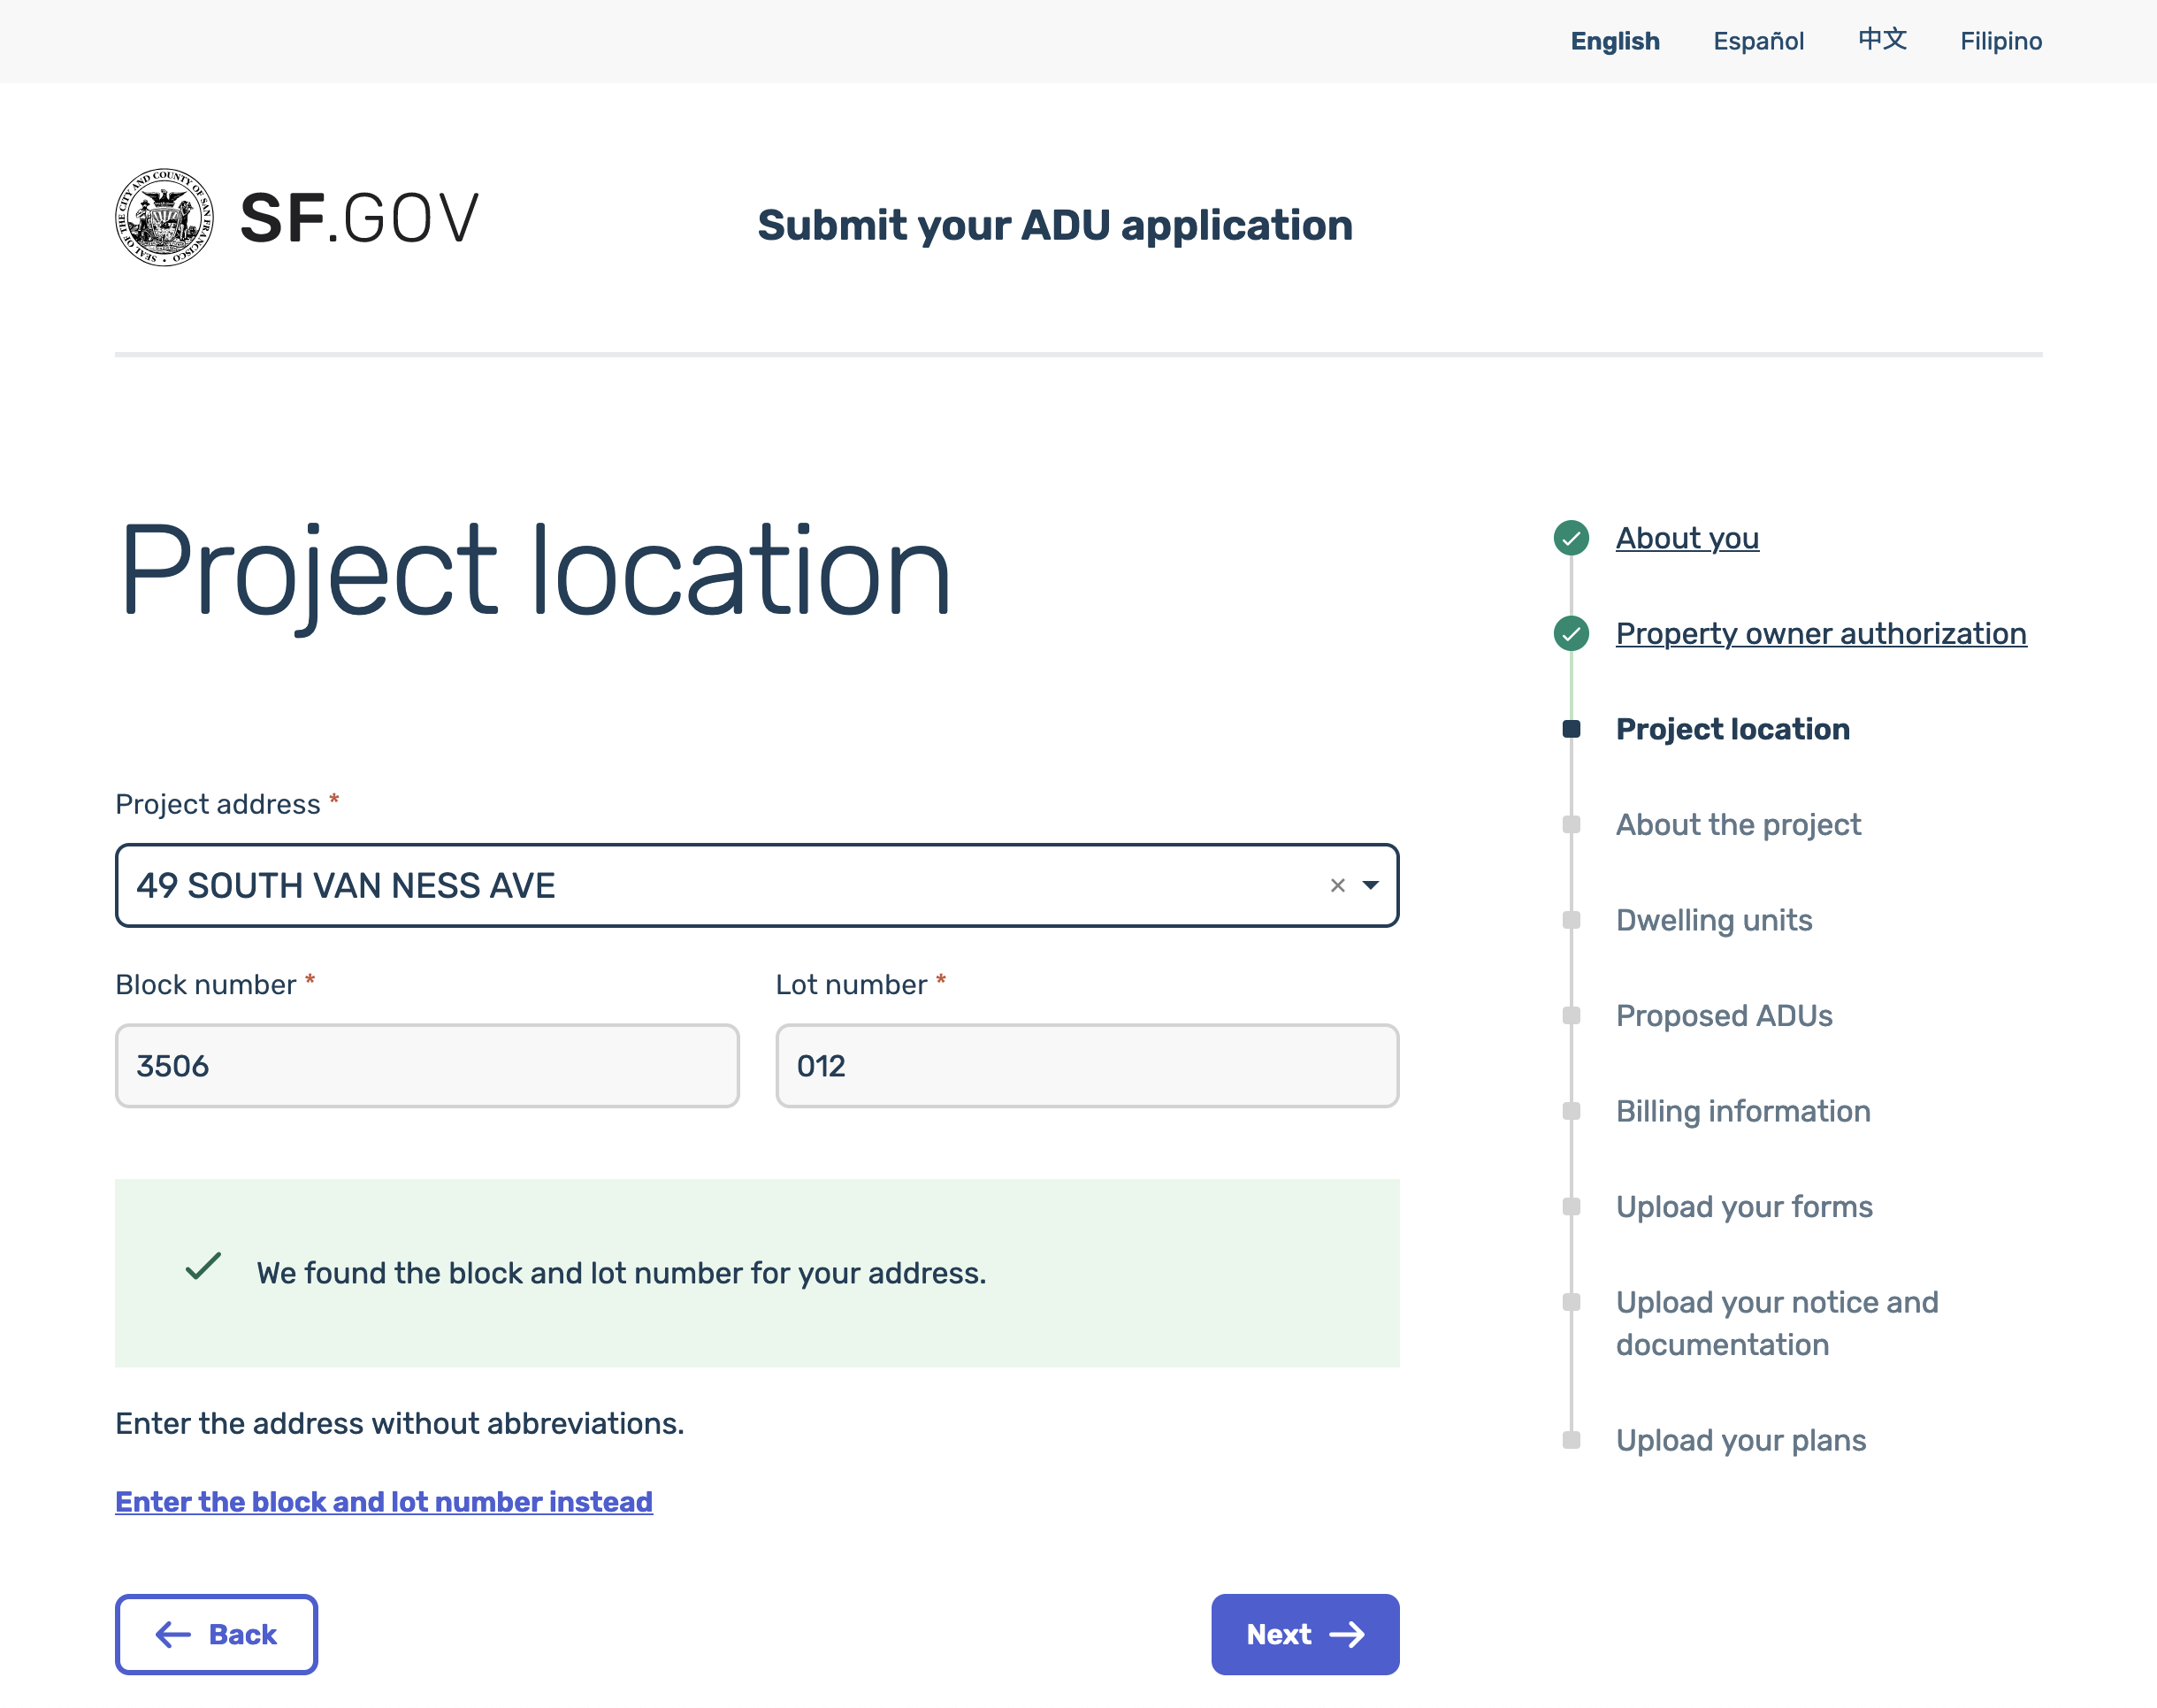
SF Digital Services engaged Truss to create the first version of the digital form from a paper-based process. We worked with them to design and develop phase 2 of the customer facing side of the Building Permit application process over two sprints. In these sprints we jointly prioritize epics and stories with SFDS decision-makers, designed and implemented those stories, and documented future work to ensure that online permitting applications would be secure, reliable, and observable.
My fellow Trussels Liz Lin, Namibia Torres, Carla Silvey, Jim Benton, and I worked shoulder to shoulder with the San Francisco Digital Services (SFDS) team to make this happen, from research to rapid prototyping to a production release. I contributed primarily to the research, design, and testing of the forms in addition to some content and light front end development.
About a year later, one of our SFDS counterparts—Bekah Otto—wrote about our work (partly) in “How to make a form.” Around the same time, another SFDSer—Lauren Jong—showed how rapid response projects like ours helped the city collect form data faster than before.